See it on your screen
Same data, anywhere, full-power on desktop, touch-friendly on the phone in your pocket.
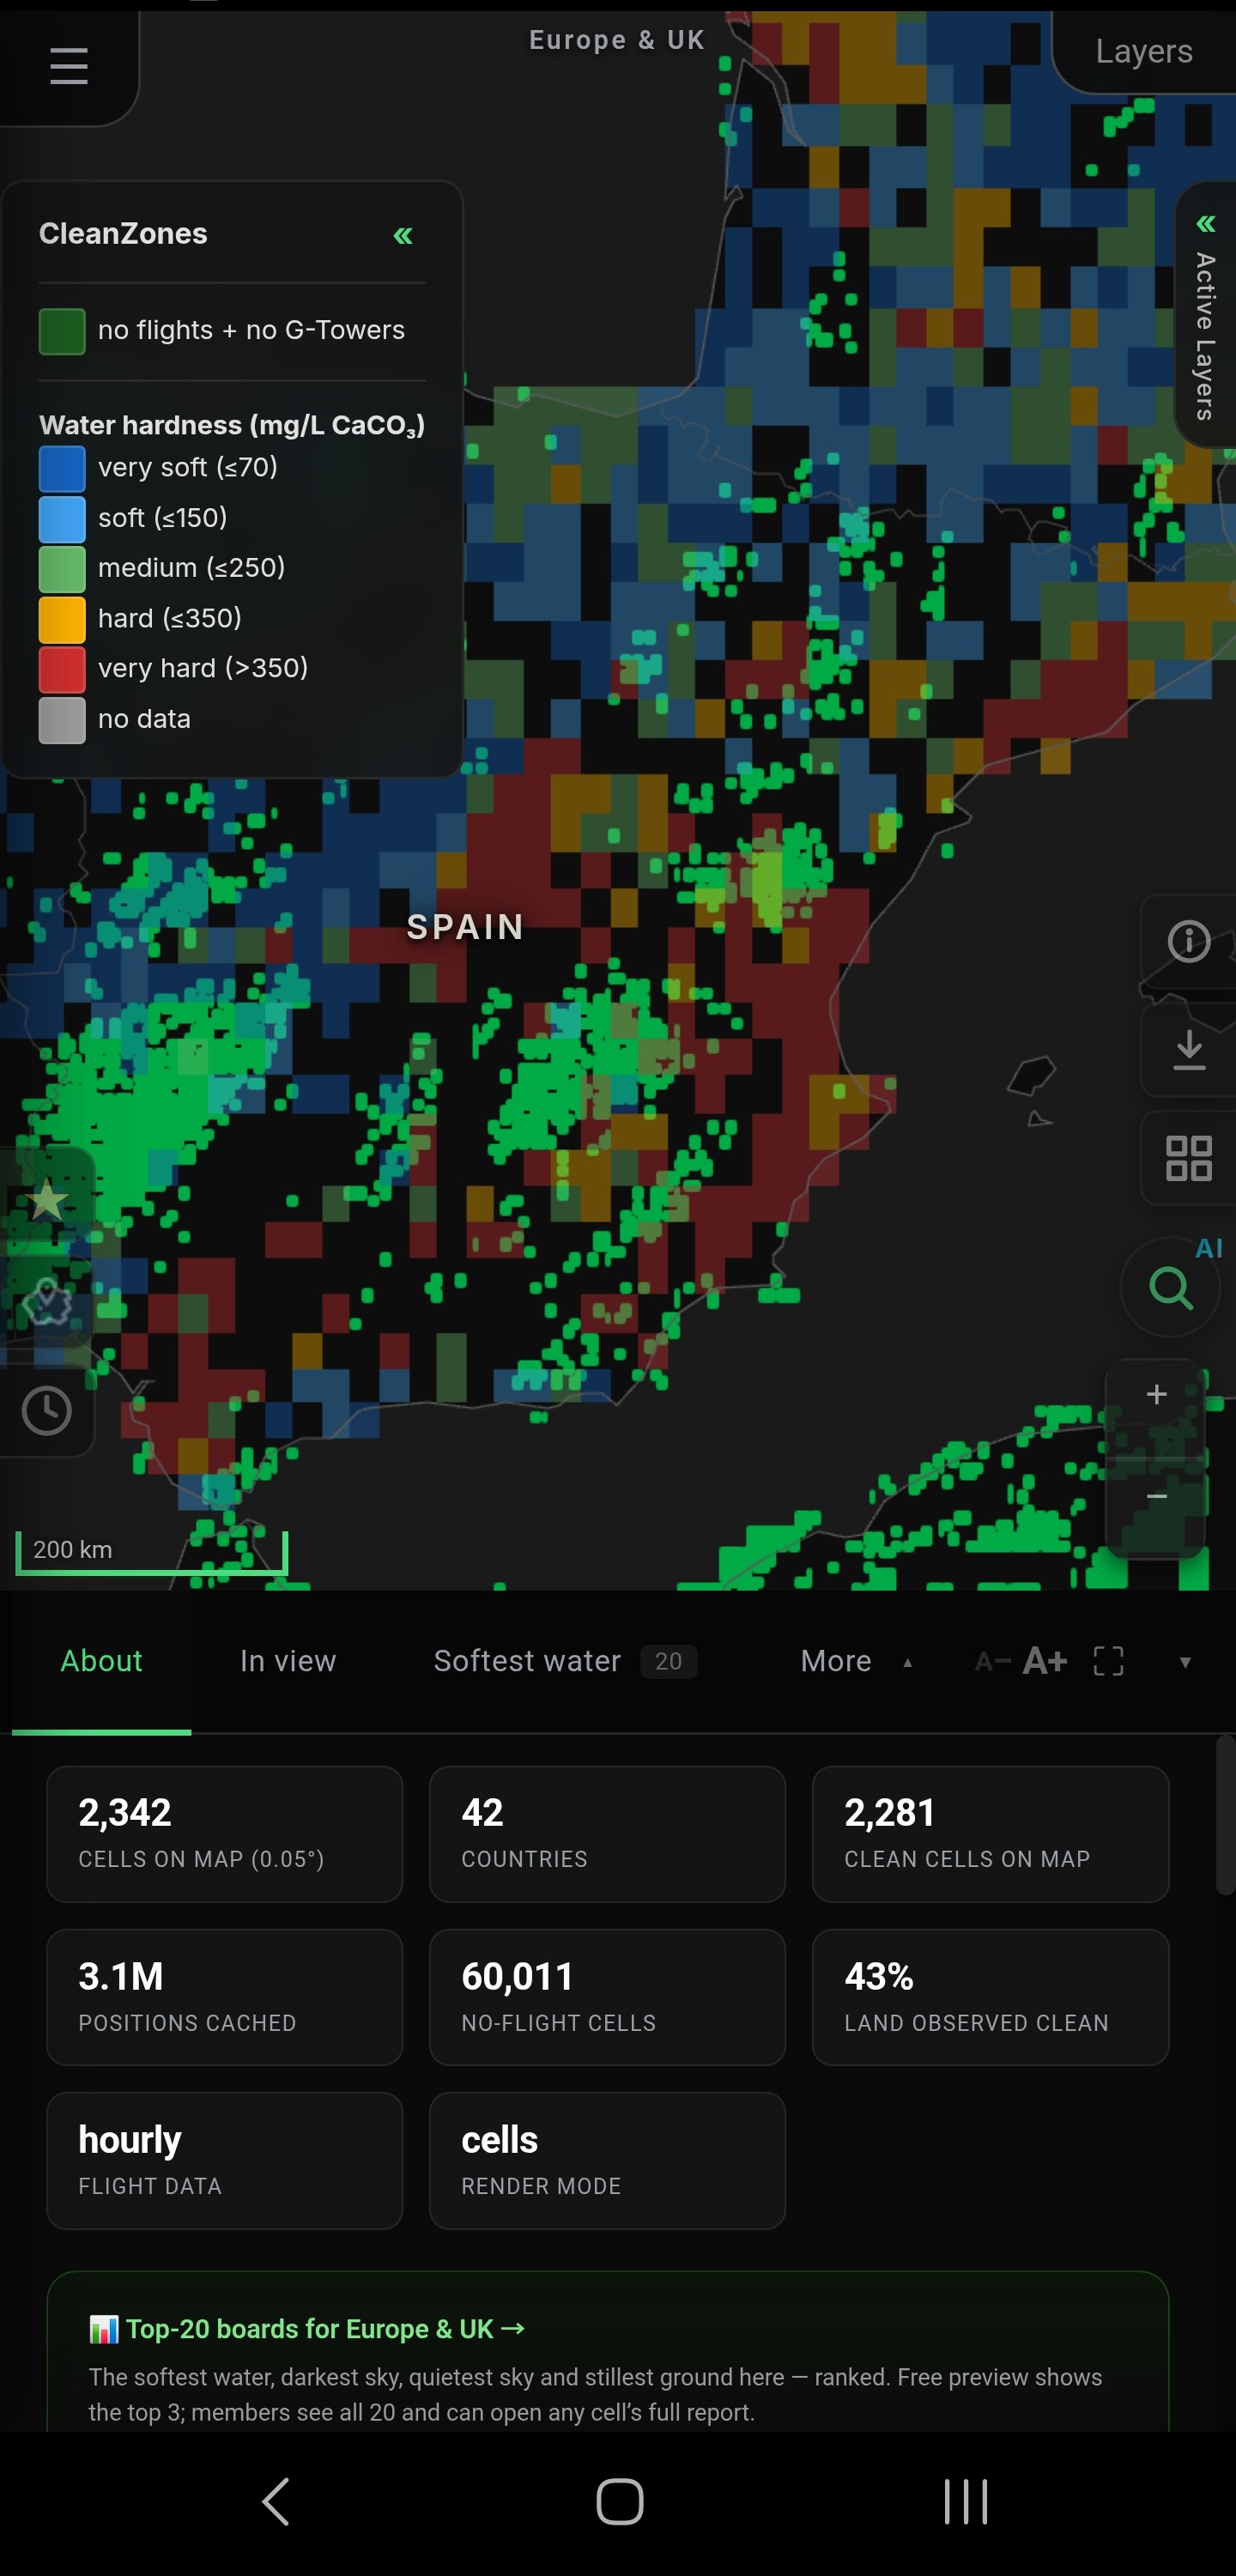
Reduce the uncertainty before you choose where to live, buy, build or study.
Every known landmass is cut into 25 km cells — sharpening down to ~1 km on flight, population and soil layers, finer still on light pollution and forest cover. Each cell carries 129 measured metrics and 140 map layers you switch on and off yourself.
Air quality and pollen. Water hardness, microplastics, aquifers and reservoirs. Soil chemistry, radon, UV and sunlight spectrum. Noise, light pollution, G-Towers, HV lines and ten years of ADS-B flight history. Population, buildings, motorways, and every industrial, chemical, waste, power and military site on file. Frost, heat, rainfall, drought, lightning, cyclones, tornadoes, tsunami and seismic hazard.
56.1 million measurements across 8 active regions plus a worldwide overview, every value tagged with the public dataset it came from, on a live interactive map. Where nobody has measured, the cell says no data. We don't fill the gap with a guess.
One cell, your numbers, about a minute. No card.
A move, a plot, a campus, a second home. Most people find out what a place is really like once they've paid for it. This does that work first, cell by cell, across every landmass.
We never call a place healthy. The water is 14 mg/L. The PM2.5 mean is 2.1. No aircraft transponder has been logged overhead in ninety days. What that's worth to you is your call.
Click a cell and the dataset behind each value is named, Copernicus, NASA POWER, OpenSky, SoilGrids, GEM, OpenCelliD, EEA. You can reproduce any figure we publish. We don't guess.
Every land cell graded on the things that quietly shape day-to-day life. We do the measurement; you find your fit.
Soft, medium, or hard, see it before you commit.
Hard water means scale, dry skin, plumbing maintenance, a lifetime of small inconveniences. Soft means easier living. Every cell graded against the same measured baseline so you don't move and find out the hard way.
A month of measurements averaged into one trustworthy number.
Brochures lie about pollution. Single-day readings fluctuate. We use a rolling 30-day mean of fine-particle concentration, banded against WHO 2005 thresholds, so "good" means good across a whole month and not merely one clean Tuesday.
Choose your level of signal saturation.
Whether high-frequency exposure matters to you, or you just want the calmer signal environment of unplugged country; we mark every cell where G-Tower transmitters have been observed. The empty cells are still empty. You can find them.
Real overflight count, taken from ADS-B.
We track every aircraft pass over every cell for ninety days. Cells that stay empty are the genuinely quiet ones, Nordic fells, Spanish meseta, Finnish lakeland. Connected-component analysis pulls out the largest contiguous quiet zones for you.
Every metric measured per cell is a layer you can switch on — 140 in 21 families, counting the mapped-site pin layers and the CleanZones marker. Real public datasets. Nothing is rolled up into a single blended number, flick any layer and see exactly what's under a cell, and which dataset said so.
Live extract from today's European dataset. Sorted by the share of land in each country free of both G-Towers and overhead flights. Islands and mainland shown separately.
| Country | Land cells | Clean | Clean % | Med Hardness | Med PM2.5 | Radon | Pop/km² |
|---|---|---|---|---|---|---|---|
| Iceland (island) | 311 | 307 | 99% | 15 mg/L | — | low | <1 |
| Finland | 988 | 780 | 79% | 11 mg/L | 1.86 | high | <1 |
| Turkey | 1303 | 883 | 68% | 253 mg/L | 9.51 | low | 11 |
| Sweden | 1251 | 806 | 64% | 14 mg/L | 2.11 | high | <1 |
| Norway | 969 | 486 | 50% | 11 mg/L | 2.45 | high | <1 |
| Latvia | 151 | 69 | 46% | 194 mg/L | 3.40 | high | 6 |
| Estonia | 113 | 43 | 38% | 201 mg/L | 3.48 | high | 4 |
| Scotland (Hebrides) | 22 | 8 | 36% | 21 mg/L | 3.01 | high | 1 |
Five things you'll do, fast for the scanner, deep for the digger.
Same data, anywhere, full-power on desktop, touch-friendly on the phone in your pocket.
Five kinds of people. One shared need: make the decision with data.
If you're considering uprooting your life, you want the homework done before you sign a lease. The platform gives you a short-list grounded in measurements instead of estate agents' adjectives.
If your client wants soft water, clean air, and a quiet sky over their next house, you can prove a candidate region works before the flight there, and quietly rule out the ones that don't.
Environmental health, water utility planning, EMF studies, relocation policy; the per-cell numbers come from public primary sources. Pull what you need; cite what you used.
Whether that's no flights overhead, no G-Towers in the next field, or both; you can find the cells where the noise simply isn't there, and have the data to back the choice.
Check the environment of a destination before you book (air quality, water, noise, flight density, EMF, heat anomalies) so you don't burn a holiday on somewhere inhospitable. Pick the village, the coast, or the valley with the numbers to match the brochure.
Who it isn't for: anyone wanting to be told where the healthiest place on Earth is. We publish the measurements and the source behind each one. Which layers matter, and how much, is your judgement; that's the part we won't do for you.
One payment. All maps, all data, all refreshes. No monthly billing, no feature tiers hidden behind a higher plan. Renews automatically each year, cancel anytime from your account.
The CleanZone Certificate
Hand it to a buyer, a tenant, a solicitor or a planner, and the questions stop. Water, air, noise, what is overhead, what is under the ground, one address, scored against the measured record, with every figure named to its source and dated.
They do not have to take your word for any of it. Every certificate carries a QR that verifies it online, and a sha256 stamp, so nobody can quietly edit a number after it is issued, including us.
One payment of $89.95. No subscription, no account, nothing recurring.
Get a certificate →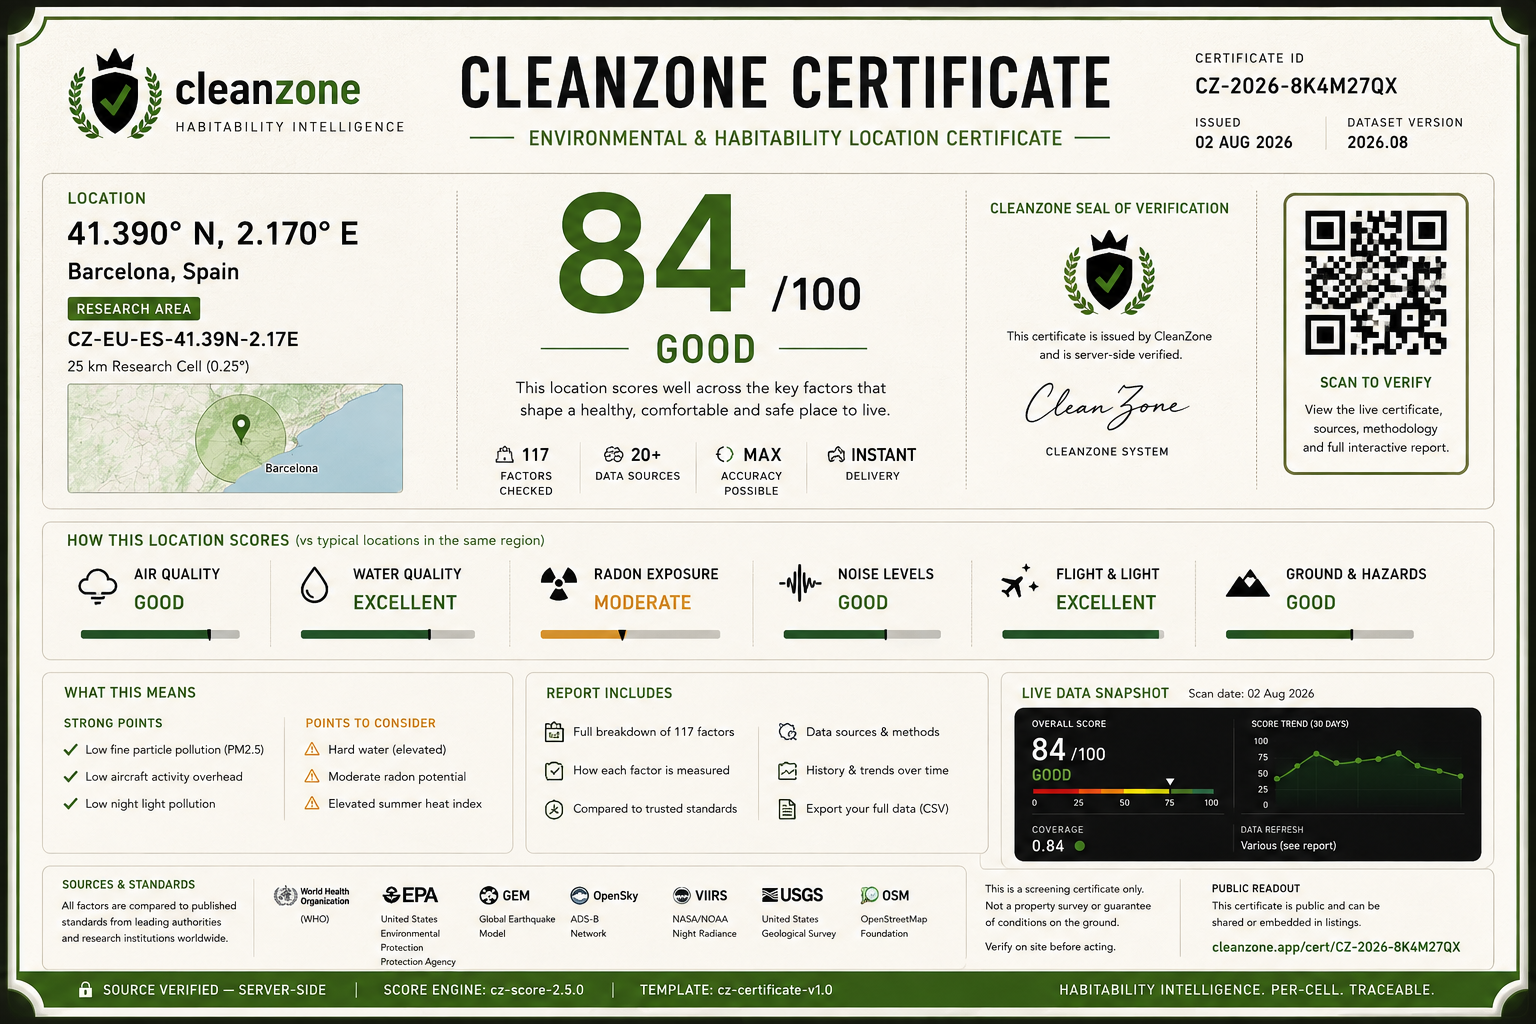
The maps tell you what the measurements show. Where measurements don't exist for an area, we mark cells as no-data rather than guess. Every cell carries the underlying source tag so you can see exactly which primary dataset it came from and reproduce the number yourself.
We don't claim "no-flights" cells are silent forever, or that "G-tower-free" cells are EMF-free in any absolute sense. We claim what the source data shows. Full methodology, source links, and per-cell provenance live inside your account.
Every layer is sourced from a public, citable dataset: OpenSky Network & ADS-BX (live + 10 yrs historical flights, 2016-2025), OpenCelliD (G-Towers, mobile-mast positions, CC BY-SA 4.0), Open-Meteo CAMS reanalysis (PM2.5 air quality), NASA POWER (UV index, UVA/UVB/PAR spectrum, temperature baseline 1991-2020 + recent 30-day mean for anomaly), Spanish SINAC + Copernicus / Weber 2021 ESSD (water hardness, As/Pb/nitrate norm), GRanD + GloFAS (reservoir levels), GHSL GHS-POP (population), VIIRS (night lights), JRC + EPA (radon potential), ISRIC SoilGrids (pH, SOC, nitrogen, clay, sand, bulk density), EEA WISE (pesticide load), OSM Overpass (industrial / power / airport / chemical / crematorium / slaughter / waste / no-fly / HV lines / motorways), FIRMS VIIRS (wildfire), JRC (flood), GEM Global Seismic Hazard Map v2023.1 (earthquake), Copernicus Global Land LC100 (forest cover), GPI & NII (political). Each cell carries a full source attribution.
No. We report what the source data shows. A "no flights" cell means OpenSky logged zero ADS-B transponder signals there over the sampling window, sharpened to roughly 1 km where coverage allows. A "no G-tower" cell means OpenCelliD lists no mast on file. Real-world conditions can differ; military aircraft, non-public towers, indoor measurements all sit outside our sources.
Flight positions accumulate hourly via live OpenSky plus a fine-grid (0.125°) ADS-BX historical heatmap covering 2016-2025.
Air-quality (PM2.5) and temperature anomaly are harvested daily through a 100-IP proxy swarm.
UV spectrum (UVA/UVB/PAR) and soil chemistry refresh weekly.
G-Tower (mobile mast) and OSM hazard layers refresh monthly from upstream bulk dumps.
CleanZones markers re-derive each cycle from the underlying flight + G-Tower + land mask.
Individual ($99/yr), one seat, full access, no restrictions.
Academic ($77/yr) — same access at a lower rate, verified .edu or .ac email required, individual research use only (not for commercial consulting).
Research Crew ($990/yr), up to 10 named users on one subscription with a shared portal and priority support.
All plans include a 7-day money-back on first payment.
Yes. Disable auto-renew from your account at any time and access continues to the end of your paid year.
7-day money-back applies on first payment.
No. CleanZone is a research instrument. It isn't a recommendation engine.
Use it as a prefilter before due diligence.
We make no claim about quality of life, real-estate value, climate suitability, or any other downstream factor.
All known land masses. Europe, Africa, Asia, Russia & Central Asia, Middle East, Oceania, South America, and US & Canada (8 active regions) all have live maps with full multi-metric coverage at 25 km cells (800,863 land cells across the eight, 897,663 including the Antarctica overlay). Several layers (flights, population, soil, light pollution, forest, seismic) sharpen well past the base grid on zoom.
Europe and US & Canada additionally carry a fine-grid 0.125° flight heatmap (2.19 M cells of yearly ADS-BX history at 4× zoom detail).
Antarctica has UV and flight overlay only.
The worldwide no-flight scan and the CleanZones marker cover every known landmass. Additional granularity is added continuously.
This is all lightweight web-based, like any common mapping service online.
A native app is on the way, due soon.
Add a bookmark or Install to Desktop in your browser on mobile or PC, exactly the same experience.
Servers are upgraded as the userbase grows to ensure a fluid experience for all.
It goes out when there's something worth sending, new layers, new tools, findings from the grid. No schedule, no noise, unsubscribe anytime.