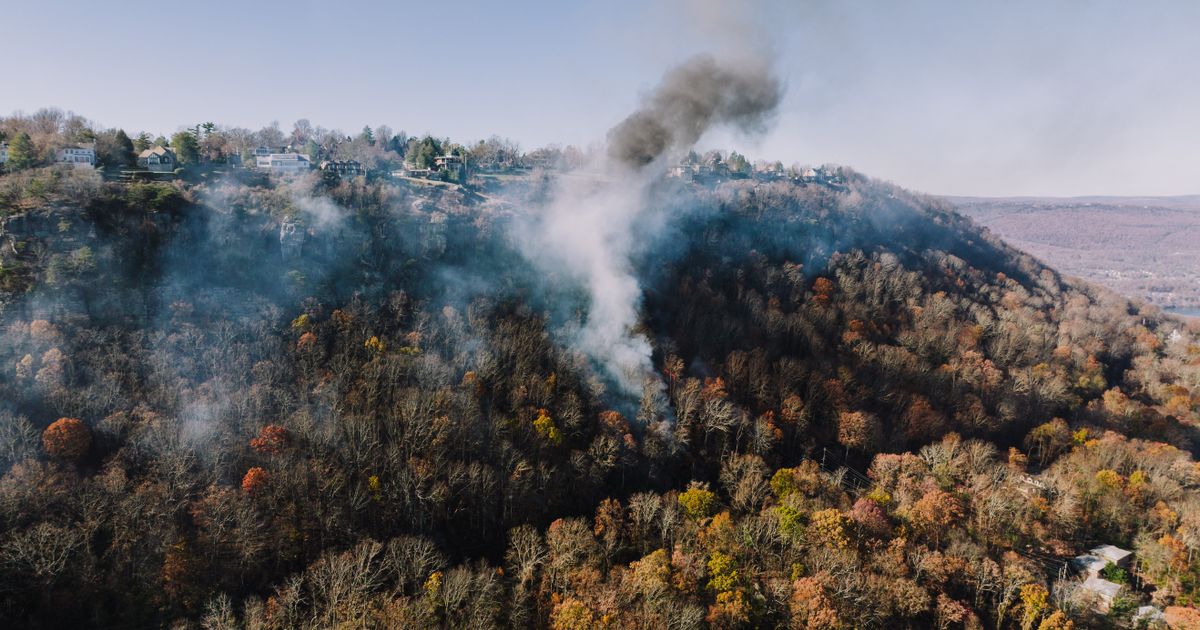
CleanZone Field Brief
Wildfire Smoke Doesn't Care About Property Lines
The distance from your front door to the nearest forest edge is not the distance from your lungs to the nearest wildfire plume. Smoke can travel hundreds of kilometres, and particulate concentrations in downwind communities can exceed local air-quality standards even when the fire itself is a state away. This is what the NOAA Hazard Mapping System, the National Interagency Fire Center, and the US Forest Service Wildfire Hazard Potential say about living near the Wildland-Urban Interface.
At a glance
- Wildfire smoke is overwhelmingly fine particulate matter (PM2.5, particles ≤2.5 micrometres wide) light enough to stay aloft for days and ride the wind hundreds to thousands of kilometres from the fire itself.
- On 7 June 2023, smoke from wildfires in Quebec pushed New York City's Air Quality Index to 484 ("Hazardous") from a fire source over a thousand kilometres away.
- The US EPA's Air Quality Index for PM2.5 (revised May 2024) runs six bands, from Good (0.0–9.0 µg/m³) to Hazardous (225.5 µg/m³ and above).
- NASA's FIRMS satellites find the fires.
- NOAA's HYSPLIT model calculates where the smoke goes next. Neither predicts ignition, both describe transport.
- Closing the windows helps, but a sealed home without filtration still runs at roughly 55–60% of the outdoor PM2.5 level during a smoke event.
Ask most people how exposed they are to wildfire and they point at a map and measure to the nearest treeline. That is the wrong ruler for the thing that actually reaches them most often. The smoke that puts a metallic taste in the air and an orange filter over the sun does not care about the treeline, the county line, or the state line; it cares about the wind, and the wind can carry a fire's exhaust further in three days than most people will drive in a year.
The particle that erases geography
Wildfire smoke is a mixture of gases and particles, but the component that dominates the public-health conversation is PM2.5 — particulate matter with an aerodynamic diameter of 2.5 micrometres or smaller, the size cut used by both the US Environmental Protection Agency (EPA) and the World Health Organization (WHO). For scale, a human hair runs about 70 micrometres across; a PM2.5 particle is roughly thirty times narrower. At that size gravity is barely a factor; the settling velocity of a 2.5-micrometre particle is measured in millimetres per hour. Combustion also lofts smoke high into the atmosphere on its own convective heat, where upper-level winds carry it for days before it mixes back down to ground level somewhere else entirely. The result behaves less like ash falling from a chimney and more like dye dropped into a river: it disperses, dilutes, and travels with the current, indifferent to whatever is drawn on a property map underneath it.
How far, and how fast
The scale is not hypothetical. On 7 June 2023, smoke from wildfires burning in Quebec was funnelled south by prevailing winds and settled over New York City. The city's AQI reached 484 that evening (deep into the "Hazardous" band) the worst air quality of any major city in the world that day, with a daily mean PM2.5 concentration of roughly 150 µg/m³, more than four times the US 24-hour ambient standard. The nearest significant fire was over a thousand kilometres away. Nobody in New York smelled a burning forest next door; the forest was a continent-scale weather system away.
Structural fire risk and smoke exposure risk are two different hazards on two different scales. Structural risk (embers, radiant heat, flame contact) operates over metres to roughly a kilometre, which is what wildland-urban interface (WUI) classification captures. Smoke exposure operates over the whole downwind footprint of a fire season, often hundreds of kilometres beyond the interface. WUI maps grade structure-loss risk and say nothing about smoke exposure, the plume routinely outruns the map by hundreds of kilometres.
The two models that turn "a fire exists" into "here comes the smoke"
NASA FIRMS, finding the fire
NASA's Fire Information for Resource Management System (FIRMS) distributes near-real-time active-fire detections from the MODIS instrument aboard the Terra and Aqua satellites (1 km resolution, a continuous record back to 2000) and the VIIRS instrument aboard the Suomi NPP and NOAA-20/21 satellites (375 m resolution, near-real-time over the US and Canada). Both work the same way: they compare the infrared brightness temperature of a pixel to its surroundings and flag it as a fire when the contrast crosses a threshold. FIRMS answers one question — where is something burning right now — and says nothing about where the smoke from it ends up.
NOAA HYSPLIT: following the plume
That second question belongs to HYSPLIT (Hybrid Single-Particle Lagrangian Integrated Trajectory), a model built and maintained by NOAA's Air Resources Laboratory. HYSPLIT is a hybrid Lagrangian–Eulerian transport-and-dispersion model: it tracks a moving parcel of smoke as it advects with the wind field, while separately resolving the atmosphere on a fixed three-dimensional grid to compute how the plume spreads and dilutes. It is the same class of model used to track volcanic ash and radiological releases. Fed by satellite-observed fire locations, it underpins NOAA's operational Smoke Forecasting System for the continental US, Alaska, and Hawaii, and the EPA's AirNow "fire and smoke" map layers HYSPLIT-modelled plumes over ground-monitor PM2.5 readings to produce the public AQI.
Reading the scale: six bands, one particle
The AQI translates a PM2.5 concentration into a single number the public can act on. The EPA revised the PM2.5 breakpoints in May 2024, tightening the "Good" ceiling from 12.0 µg/m³ to 9.0 µg/m³ and lowering several upper bands, in response to epidemiological evidence of health effects at lower concentrations than the 1999 scale assumed. A single smoke event can walk a location through several of these bands in a single afternoon.
The wildland-urban interface: a fire map wearing a smoke problem's clothes
The WUI is the zone where housing meets or intermingles with wildland vegetation, mapped nationally by the US Forest Service and the University of Wisconsin–Madison SILVIS Lab from Census housing data and land-cover classification. On the most recent (2020) assessment it covers roughly 9% of the land area of the contiguous US but contains about 44 million housing units — close to a third of the national housing stock. The WUI map is genuinely useful for what it was built for: predicting where embers and flame contact threaten structures. It was never built to describe smoke exposure, and using it that way understates the problem; the map has a hard edge; the plume does not.
Seasonality: when the corridors open
Fire-and-smoke season is not a single calendar window, it shifts with the fuel and climate cycle of each region. The National Interagency Fire Center's seasonal outlooks consistently show the western US carrying elevated significant-fire potential from roughly June through October, driven by summer drying of forest and shrub fuels. Boreal Canada follows a similar May-to-September arc; the source of the smoke that has repeatedly reached the US Northeast and Midwest in recent years. The southeastern US runs on a different clock entirely: its fire activity, tied to prescribed burning and drier winter-spring conditions in pine and grassland fuels, tends to peak in late winter and early spring. A property can sit outside every western fire-season month and still take a smoke hit on a completely different seasonal cycle, from a completely different direction.
Indoors is not the same as unexposed
Closing the windows is not nothing, but it is not a seal either. Field measurements compiled through the EPA's AirNow programme found that in a closed home without a portable air cleaner running, indoor PM2.5 during a wildfire smoke event typically sits at 55–60% of the outdoor concentration, with a documented range as wide as 30–100% depending on the building's leakiness and HVAC configuration. Adding a correctly sized portable HEPA air cleaner is where the picture changes: field studies of US residences during smoke episodes recorded the indoor-to-outdoor PM2.5 ratio drop to around 0.19 with a HEPA cleaner running, and to roughly 0.18 when combined with an upgraded HVAC filter, both well under half of the no-filtration baseline.
A MERV-13 filter (the ASHRAE 52.2 grade the EPA recommends for wildfire smoke) is rated to remove at least half of particles in the 0.3–1.0 µm range and roughly 85% of the 1.0–3.0 µm range that covers most wildfire PM2.5, but only for the air that actually passes through it. During a multi-day smoke event, EPA and CDC guidance both centre on building or buying a single sealed "clean room" sized to a correctly rated air cleaner. A shut front door protects nothing on its own.
Structural fire risk
Governed by ember cast and flame contact, metres to roughly a kilometre. Assessed via USFS Wildfire Hazard Potential and WUI classification. Drives home-hardening, defensible space, and insurance underwriting.
Smoke exposure risk
Governed by prevailing wind and upwind fuel loads across an entire fire season, hundreds to well over a thousand kilometres. Tracked via NASA FIRMS detections, NOAA HYSPLIT trajectories, and EPA AirNow AQI. Drives respiratory-health exposure days, WUI status notwithstanding.
A property can sit zero kilometres inside the WUI and still log more hazardous-air days a year than one built on the treeline; because the wind decides who breathes the plume, and the deed has no say.
The CleanZone map records pm25 for every 25 km cell, alongside wildfire risk and wildland proximity. The data trace to EPA AirNow, NOAA's Hazard Mapping System and HYSPLIT dispersion model, NASA FIRMS satellite fire detections, and USFS / SILVIS WUI classification — the same operational datasets used by air-quality forecasters and fire-management agencies. Get Access to run the check before you buy.