CleanZone Field Brief
Flight Paths and Five Bars
There is a class of neighbourhoods that look peaceful on a Sunday afternoon and are intolerable once you live in them. They have tree-lined streets, low traffic, and excellent mobile reception. They also sit directly under an aircraft approach path and within dense G-Tower coverage. The eye sees one thing; the data shows another. Here is how to find the overlap before you move.
At a glance
- The FAA's 65 dB DNL contour is the regulatory line for "significant noise exposure" under 14 CFR Part 150 — it triggers land-use review and, in some cases, funded sound insulation.
- Night flights (10pm–7am) are added into that average with a 10 dB penalty, which (because decibels are logarithmic) makes one red-eye departure count roughly like ten identical daytime ones.
- Overflight concentrates along the extended runway centerline. The circle drawn around a terminal describes nothing. A house 8 nautical miles out but on-track logs more passes than one a mile away but off to the side.
- A standard 3° glideslope means an aircraft is barely 640 ft up at 2 nautical miles from touchdown, altitude buys distance-related attenuation and little else. CleanZone's
flightsfield bins OpenSky ADS-B position reports per cell, hourly, into an overflight-frequency count rather than a single "near an airport" flag.
Wrong question: "how close is the airport?"
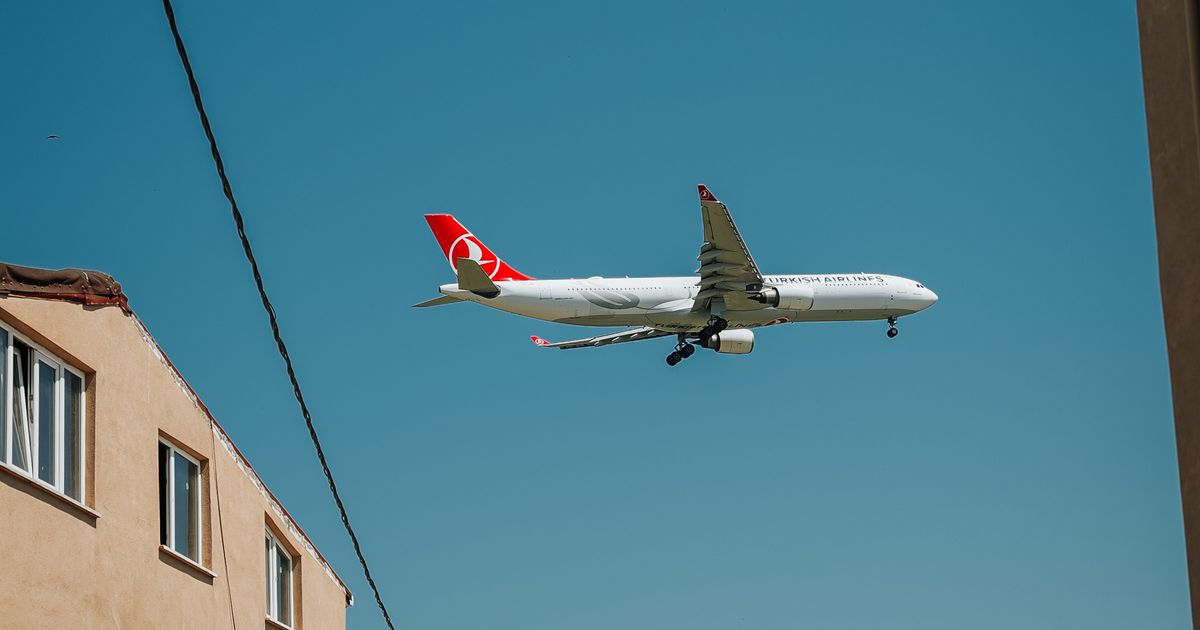
Ask someone why their new house is quiet despite sitting three miles from a major hub and they'll usually point at the map: "we're not under the flight path." They are, without knowing it, naming the only variable that actually matters, and most buyers never check it before signing. Proximity to the airport reference point is a poor proxy for noise exposure. What matters is whether the property sits on the ground track that arriving and departing aircraft actually fly, which is a corridor rather than a radius.
Two houses can sit at an identical distance from the runway threshold and experience wildly different overflight counts, because one is under the extended centerline and the other is a mile off to the side, outside the lateral spread of the approach and departure procedures. The airport's footprint on a map is round. Its noise footprint is not.
The FAA's 65 dB line
In the United States, aircraft noise exposure is regulated around a single cumulative metric: Day-Night Average Sound Level (DNL), defined in FAA Order 1050.1 and used as the compatibility yardstick under 14 CFR Part 150. DNL is not a single flyover's loudness; it is an annualised, 24-hour energy average of every aircraft noise event at a point, expressed in decibels. The FAA treats 65 dB DNL as the threshold of "significant noise exposure": land inside that contour is considered incompatible with new residential development without mitigation, and airports with existing homes inside it can become eligible for FAA-funded sound insulation programs.
Because DNL is an average, a property can breach 65 dB DNL even if no single flyover ever feels dramatic in isolation; it is the accumulation across hundreds of daily events that pushes the annualised number over the line. Conversely, a property can sit close to a runway and stay under 65 dB DNL if traffic volume is low or the runway-in-use rarely points that way.
Why night flights count ten times over
The DNL formula does something specific: before averaging, every noise event that occurs between 10pm and 7am has 10 dB added to it. Because sound energy is logarithmic, adding 10 dB is not a 10% bump; it is roughly a tenfold increase in the acoustic energy that event contributes to the average. In practical terms, one departure at 2am is weighted in the annual metric as if it were about ten identical departures during the day.
This penalty comes from the EPA's 1974 "Levels Document" methodology, which the FAA subsequently adopted for aviation noise. The logic: sleep disturbance from a single loud event has an outsized effect on wellbeing compared with equivalent daytime exposure, so the metric weights it that way rather than treating every hour as equal.
The consequence for house-hunting: two airports with identical total daily movements can produce very different DNL contours depending on how those movements split between daytime and the 10pm–7am window. A cargo hub with a handful of overnight freighters can generate a larger 65 dB contour than a much busier airport that shuts down operations overnight.
The corridor, and where it lands
Departure and arrival procedures (SIDs and STARs) funnel aircraft onto defined lateral tracks that converge tightly at the runway threshold and widen gradually with distance as aircraft turn onto assigned headings or intercept the final approach course. The result on the ground is an elongated corridor of concentrated overflight tracking the extended runway centerline for miles in both directions instead of a ring of noise radiating evenly outward from the terminal building.
The 65 dB DNL contour is not a circle of a given radius around the terminal; it hugs the extended runway centerline and can extend for miles along the approach and departure tracks while staying narrow laterally. A house half a mile off that line can be meaningfully quieter than one five miles down it.
Altitude buys decibels
A standard instrument approach uses a 3° glideslope, the angle codified in ICAO Annex 10 and used by the overwhelming majority of ILS-equipped runways. That geometry is fixed and gives a precise, non-negotiable altitude at any distance from the threshold: at 2 nautical miles out an aircraft on glideslope is at roughly 640 ft AGL; at 6 nautical miles, roughly 1,910 ft; at 10 nautical miles, roughly 3,180 ft. None of those numbers are especially high, commercial jets remain audible well past all of them.
Two physical effects are stacked here. Distance attenuation follows roughly an inverse-square spreading pattern in free field (about 6 dB less per doubling of distance) before atmospheric absorption is even factored in. But absorption itself is frequency-dependent: high-frequency content fades fastest with slant distance, while the low-frequency rumble of jet engines and airframe noise travels much further with less loss. That is the acoustic reason a departing aircraft can still be heard as a low rumble long after the higher-pitched whine has disappeared, and why homes several miles down a departure corridor still register real, measurable noise events rather than silence.
Counting overflights instead of guessing
The OpenSky Network publishes historical ADS-B position reports from aircraft transponders across Europe and North America, latitude, longitude, altitude and track, reported roughly once a second per aircraft. CleanZone bins those historical position reports per grid cell on an hourly basis, producing the flights field: an expected-overflight-frequency count for that cell rather than a single binary "near an airport" flag. A cell directly under a busy arrival corridor accumulates a high hourly count across the full historical window; a cell a mile off to the side, even at an identical straight-line distance from the airport, accumulates far fewer passes because it sits outside the lateral corridor that traffic actually flies.
On the corridor
Aircraft pass on a predictable schedule tied to the airport's runway-in-use and procedure design. Overflight count is high and repeats daily regardless of how far along the corridor the property sits. Even at 8–10 NM out, aircraft remain low enough on a 3° glideslope that each pass registers as its own event.
Off the corridor
The same straight-line distance from the airport, but outside the lateral spread of departure and arrival procedures. Overflight count drops sharply because traffic simply doesn't route overhead. This is why "close to the airport" and "under the flight path" are frequently two different addresses.
A brief word on 5G
CleanZone also carries a g5_count field, 5G site density per cell, from OpenCelliD tower positions. It is worth a factual mention because the two exposures sometimes get conflated in casual conversation about "invisible" nuisances near infrastructure. But they are not comparable in scale: at typical public distances from cell infrastructure, measured RF exposure sits far below the ICNIRP reference levels used internationally, whereas the DNL contour is an FAA-codified land-use threshold with real regulatory teeth. For a genuinely quiet street, the overflight corridor is where the evidence-based scrutiny belongs.
CleanZone bins historical ADS-B overflight into the flights field, hourly, per 25 km cell, a frequency count rather than a single "near an airport" flag. A cell with a low count is not guaranteed silence, but it is no longer a guess about which side of the runway centerline a property happens to sit on.