CleanZone Field Brief
What 500 Metres From a Tower Actually Means
Estate agents rarely specify whether "500 metres from a tower" refers to a GSM sector antenna at 15 metres height or a 400 kV overhead line on a 40-metre pylon. The two sources are measured in different units, regulated under different bodies, and fade at radically different rates. Here is the physics, the standards, and how to read a property through both lenses.
At a glance
- Power density falls with the square of distance, double the distance, quarter the field. It is the single biggest lever on any real-world reading, bigger than transmitter power itself.
- Cell towers emit radio-frequency (RF) power density — µW/cm² or W/m², at 700 MHz–6 GHz. Power lines produce a completely unrelated quantity, power-frequency (ELF) magnetic flux density: µT, at 50/60 Hz. Different physics, different regulator, different units.
- ICNIRP's 2020 general-public RF reference level runs from roughly 350–450 µW/cm² at 700–900 MHz up to 1,000 µW/cm² (10 W/m²) at 2 GHz and above; national monitoring campaigns typically measure ordinary streets one to three orders of magnitude below that.
- IARC's 2011 "Group 2B; possibly carcinogenic" classification for RF-EMF means limited evidence, not established risk, the same evidentiary tier as pickled vegetables, several rungs below tobacco or asbestos (Group 1).
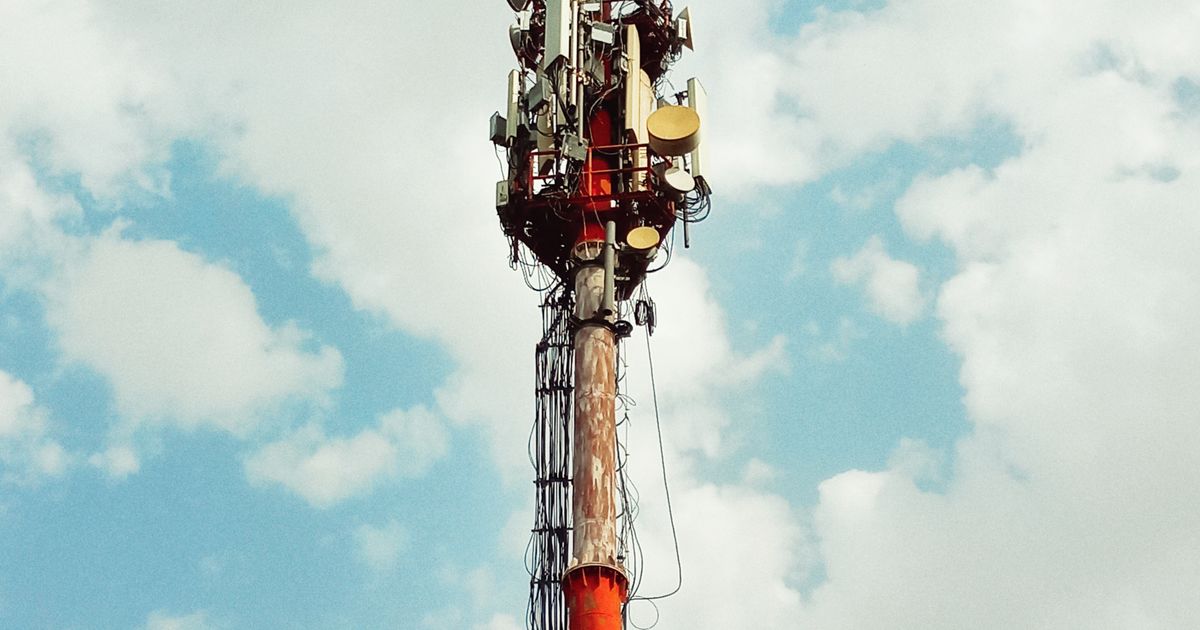
- A rooftop panel antenna is tilted to clear its own mast; the ground directly beneath is often quieter than the pavement 50–150 m along the beam.
Somewhere in nearly every relocation search sits a listing that mentions, almost as an aside, a mast on the ridge or pylons along the field boundary, and a buyer who quietly marks the price down in their head. The instinct is human. It is also, in the large majority of cases, pointed at the wrong variable. What actually governs exposure at a given address is not whether a tower or line exists nearby, but four things: distance, geometry, frequency, and which of two entirely different physical phenomena; radio-frequency radiation from an antenna, or a power-frequency magnetic field from a conductor; is even the one in question. Get those four right and "there's a mast on the hill" stops being a verdict and starts being a number.
Same word, two different phenomena
"EMF" functions as a single catch-all in casual conversation, but a cell tower and a high-voltage transmission line do not compete on the same scale, answer to the same regulator, or even get measured in the same unit. Confusing them is the most common error in this subject, and it runs in both directions: a worry about a nearby 5G mast says nothing about risk near a substation, and vice versa.
Most people picture a single invisible field, spreading out of anything with a wire or an antenna and getting vaguely worse the closer you stand, with towers and pylons treated as interchangeable sources of the same risk. The instruments measure two unrelated quantities. RF from a mast is a power density in µW/cm² or W/m², oscillating somewhere between 700 MHz and 6 GHz, and it is governed by ICNIRP's 2020 high-frequency guidelines. ELF from a power line is a magnetic flux density in µT at 50 or 60 Hz, governed by ICNIRP's separate 2010 low-frequency guidelines. Different unit, different physics, different guideline document.
The inverse-square law: the fact that matters most
Power radiating from a small source spreads over the surface of an ever-larger sphere. Double the distance and that energy is spread over four times the area, so power density falls to a quarter; treble the distance and it falls to a ninth. This is the inverse-square law, and it is the reason "how far" dominates every other variable in a casual EMF conversation — a transmitter would need to increase its power a hundredfold just to offset a tenfold increase in distance.
Distance does almost all of the work for you, no regulation, filter, or app changes exposure as reliably as walking further away. It is also the one variable a buyer already controls: which side of the plot the house sits on, and how far the bedroom window is from the boundary nearest the source.
Radio-frequency fields: cell towers and small cells
Cellular base stations in Europe and the United States are licensed by national regulators (Ofcom, FCC, ARCEP, Bundesnetzagentur) which publish site databases containing latitude, longitude, antenna height, azimuth, frequency band, and effective isotropic radiated power (EIRP). From these fields an electromagnetic-field model can estimate the expected power density in µW/cm² at any point on the ground; none of the registries compute that figure for you directly.
The falloff is not linear, and it is not symmetric. Panel antennas on rooftops and lattice masts are directional, tilted a few degrees below horizontal ("downtilt") so the main lobe clears the mast's own rooftop and reaches the next street rather than spraying straight down. That is why the highest ground-level field is typically found 50 to 150 metres out along the beam axis rather than directly beneath the mast, which often sits in the antenna's near-field shadow. Beyond the main lobe, power density drops roughly with the square of distance in free space, but ground reflections and building diffraction create lobes and nulls that make a naive inverse-square estimate unreliable at kerb-side precision; a reading at the pavement can be double or half the one taken a metre inside the garden wall.
The International Commission on Non-Ionizing Radiation Protection (ICNIRP) publishes the reference levels national regulators (including the UK and EU member states) adopt for public RF exposure; the current version is the 2020 guidelines covering 100 kHz to 300 GHz. Because these are frequency-dependent, there is no single number: at 700 MHz (low-band 4G/5G) the general-public reference level works out to roughly 350 µW/cm²; at 900 MHz (2G/3G and part of 4G) roughly 450 µW/cm²; from 2 GHz upward (mid-band 5G and Wi-Fi territory) it plateaus at 1,000 µW/cm² (10 W/m²). The localized exposure that matters when standing near an antenna is averaged over any 6-minute interval. The WHO has stated the ICNIRP guidelines are designed to prevent all established adverse health effects with a substantial safety margin built in.
National RF-monitoring programmes (France's ANFR and the UK's Ofcom among them) publish thousands of on-site public spot-measurements a year, and both consistently report ambient levels at a small fraction of the applicable reference level on ordinary streets. Readings in the region of 0.01 to 10 µW/cm² at ground level in publicly accessible areas are typical; the higher end is usually found within roughly 50 metres of a beam's main lobe at pavement level, and readings beyond 200 metres routinely fall below 0.1 µW/cm². That leaves a gap of one to three orders of magnitude between everyday measured values and the ICNIRP ceiling.
This is national monitoring, and nobody is selling anything with it. ANFR's public measurement campaign and Ofcom's routine site audits exist precisely because "trust the licence" isn't good enough for regulators either. Both publish raw, on-site figures; neither exists to reassure, and both keep finding the same thing: ordinary ground-level exposure sits well under the ICNIRP ceiling.
Power-frequency fields: high-voltage lines and substations
Overhead transmission lines operate at 50 Hz (Europe) or 60 Hz (North America). The relevant quantities here are the electric field in kilovolts per metre (kV/m) and the magnetic flux density in microtesla (µT). Unlike radio-frequency fields, these are not governed by ICNIRP's power-density limits but by its separate guidelines for static and low-frequency fields.
For the general public, ICNIRP's 2010 low-frequency guidelines set an electric-field reference level of 5 kV/m and a magnetic-flux-density reference level of 200 µT at 50 Hz — both comfortably above anything a residential property records outside the wayleave itself. National regulations often add further constraints: for example, some European jurisdictions apply a 1 kV/m threshold for new housing directly underneath or adjacent to lines. The US National Institute of Environmental Health Sciences (NIEHS) and the Institute of Electrical and Electronics Engineers (IEEE) maintain comparable frameworks.
The electric field from an overhead line decays rapidly with lateral distance. A 400 kV double-circuit line at typical conductor height produces roughly 4 to 8 kV/m directly beneath the conductors, falling to roughly 1 kV/m at 50 metres lateral offset and below 0.1 kV/m at 200 metres. Magnetic fields decline more slowly (roughly as 1/r for a single line, faster for cancellation-designed double-circuit arrangements) but also depend heavily on load current, which varies by time of day and season, so a single spot reading is a snapshot of one moment's load.
| Source type | Primary metric | Reference limit (general public) | Typical measured near property |
|---|---|---|---|
| Cell tower (700 MHz – 6 GHz) | Power density (µW/cm²), averaged 6 min | ICNIRP: 350–1,000 µW/cm² (freq.-dependent) | 0.01 – 10 µW/cm² ground level; usually < 1 µW/cm² beyond 100 m |
| HV overhead line (400 kV, 50 Hz) | Electric field (kV/m) | ICNIRP: 5 kV/m | 4 – 8 kV/m beneath conductors; ~1 kV/m at 50 m lateral; < 0.1 kV/m at 200 m |
| HV overhead line (same, magnetic) | Magnetic flux density (µT) | ICNIRP: 200 µT at 50 Hz | 0.5 – 5 µT beneath; ~0.2 µT at 50 m; declines with load current |
| Distribution substation (11 kV / 0.4 kV) | Magnetic flux density (µT) | ICNIRP: 200 µT at 50 Hz | < 0.1 µT at property boundary; rarely detectable inside neighbouring homes |
What "possibly carcinogenic" actually means
In 2011 the International Agency for Research on Cancer (IARC), WHO's cancer-classification body, placed radiofrequency electromagnetic fields in Group 2B ("possibly carcinogenic to humans") citing "limited evidence" of increased glioma risk among the heaviest historic users of handheld mobile phones, a signal drawn from phone-to-head exposure rather than from ambient base-station exposure. IARC's five-tier scale runs from Group 1 (carcinogenic to humans, established beyond reasonable doubt: tobacco smoke, asbestos, solar UV, processed meat) down through 2A ("probably"), 2B ("possibly"), 3 (not classifiable) to 4 (probably not carcinogenic). Group 2B is the tier for "limited evidence in humans and less than sufficient evidence in animals", the same category as several hundred other agents, including pickled vegetables and aloe vera extract. Coffee sat in Group 2B for over two decades before IARC reclassified it as "not classifiable" in 2016 once better data arrived. RF-EMF has not moved since 2011; that stability reflects an evidence base that has grown without resolving the original "limited" rating. No committee is sitting on damning results.
2B means the case is unresolved. It is not closed in either direction. It is neither a clean bill of health nor a confirmed hazard; treat any claim that leans on "2B" to argue towers are either perfectly safe or provably dangerous with the same scepticism.
Field strength falls with the square of distance. That inverse-square law is the single fact that does more to lower real exposure than any regulation on the books.
What the databases actually tell you
Sitefinder (UK), ANFR Cartoradio (France), BNetzA (Germany), and the FCC ASR database (US) all publish mast locations. None of them computes ground-level exposure for you. They give antenna height and power, from which a ray-tracing or empirical-field model can be run. Substation data is harder: most distribution substations are unmapped at parcel level, though transmission substations above 100 kV are usually listed in transmission-system operator datasets.
The CleanZone grid models g5_count, 5G site density per cell, built from OpenCelliD tower positionshv_lines, proximity to mapped high-voltage line and substation infrastructure, from grid-operator and OpenStreetMap data. These are modelled values at cell level. Nobody has taken a meter to your street. They rank cells against each other ("this cell carries more tower density than that one") not judge any single bedroom window. The only way to confirm compliance at a specific address is an on-site survey with a calibrated broadband field meter.
How to check a specific address
- Pull the national transmitter registry and list every site within 1 km
- Check antenna height and direction: a 25-metre roof-mounted panel on a 30-metre building has a very different footprint than a 50-metre lattice mast in open ground
- Map overhead power lines from OpenStreetMap or the transmission operator's corridor map
- Identify the nearest mapped substation and check its voltage class; distribution-level units rarely extend meaningfully beyond their fence
- Cross-check the CleanZone grid's
g5_countandhv_linesfields to see how the cell ranks against others, then verify on the ground - Use a free path-loss calculator (e.g., ITU-R P.452 for terrestrial links, a Two-Ray model for ground reflections) to estimate power density at your specific height above ground
- Consider commissioning an accredited RF survey if the modelled value is within an order of magnitude of the ICNIRP limit
The CleanZone map models g5_count (5G site density) and hv_lines (HV-line proximity) for every 25 km grid cell from public registries. It ranks cells. A bedroom is a different scale of question. For a specific property, model first, then measure; inverse-square distance and a calibrated meter beat a guess about "how close is too close" every time.